
Cartography:
A kind of mini-portfolio of maps I've made! I can't host all of the full-sized images here, but click on the images to download the mini versions.
Denver Survey:
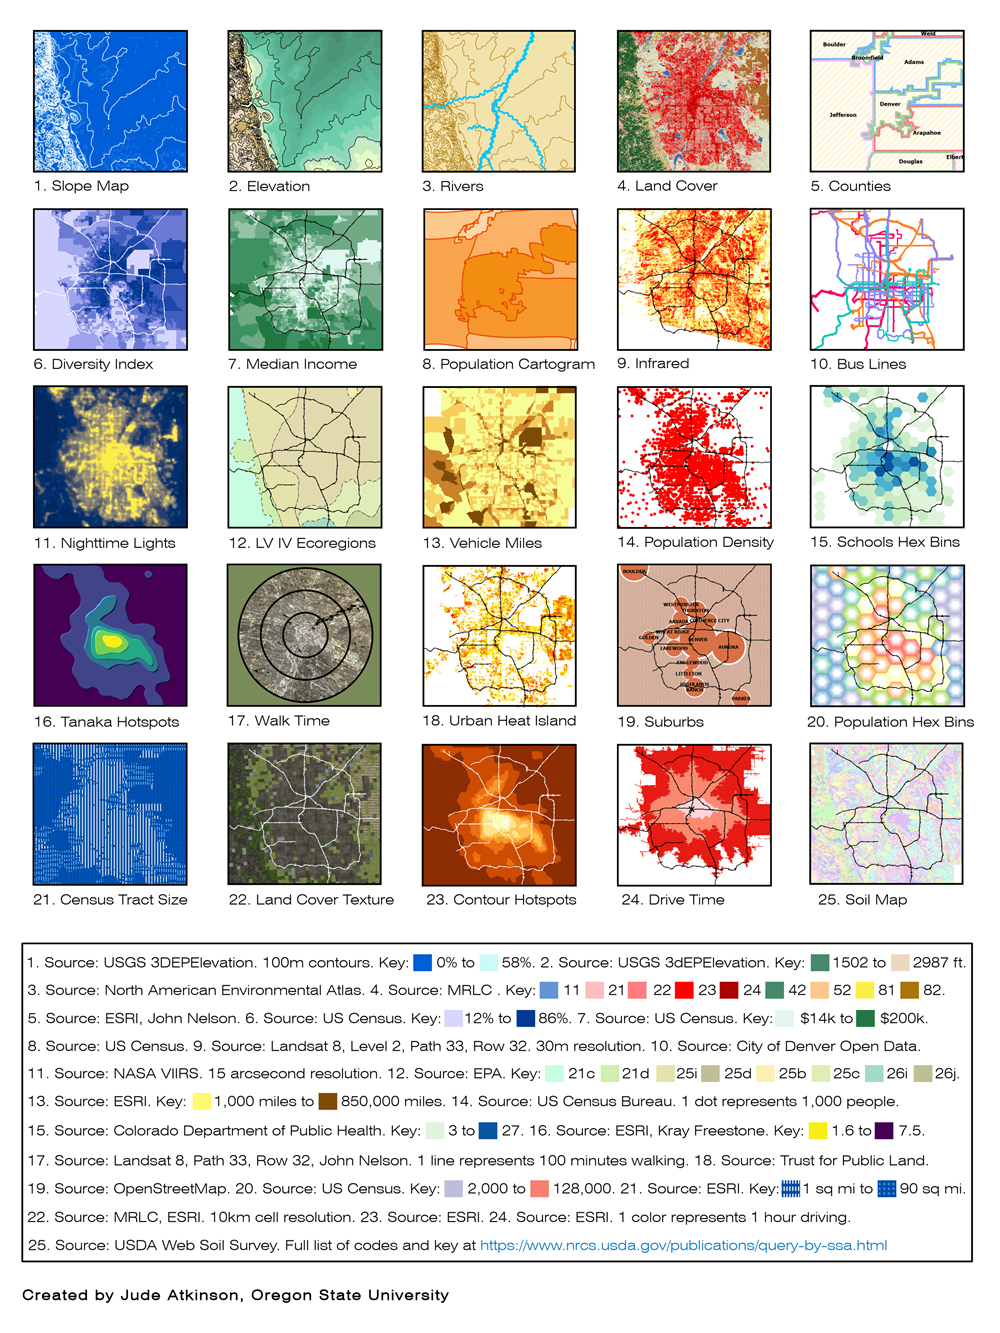
Sooo this one doesn't have much of a story behind it. I wanted to practice my skills in mapping software & design with a cumulative project. Something front-and-center in the GIS portfolio. I chose to map one city area with a variety of spatial techniques and data sources.
I chose Denver for its circular shape and varied land cover, then spent a week or so in the lab, and ta-da!
Interesting points from this one: The original file is just big and storage-greedy so this copy is of much lower quality (sorry). It's the last map I ever made with my university's enterprise GIS. I wanted to make more than 25 visualizations, but I ran out of space on the page. I was inspried by cartographers Patrick Abercrombie, Kirito Tanaka, and "Coolest guy online" John Nelson.
S5 Layout:
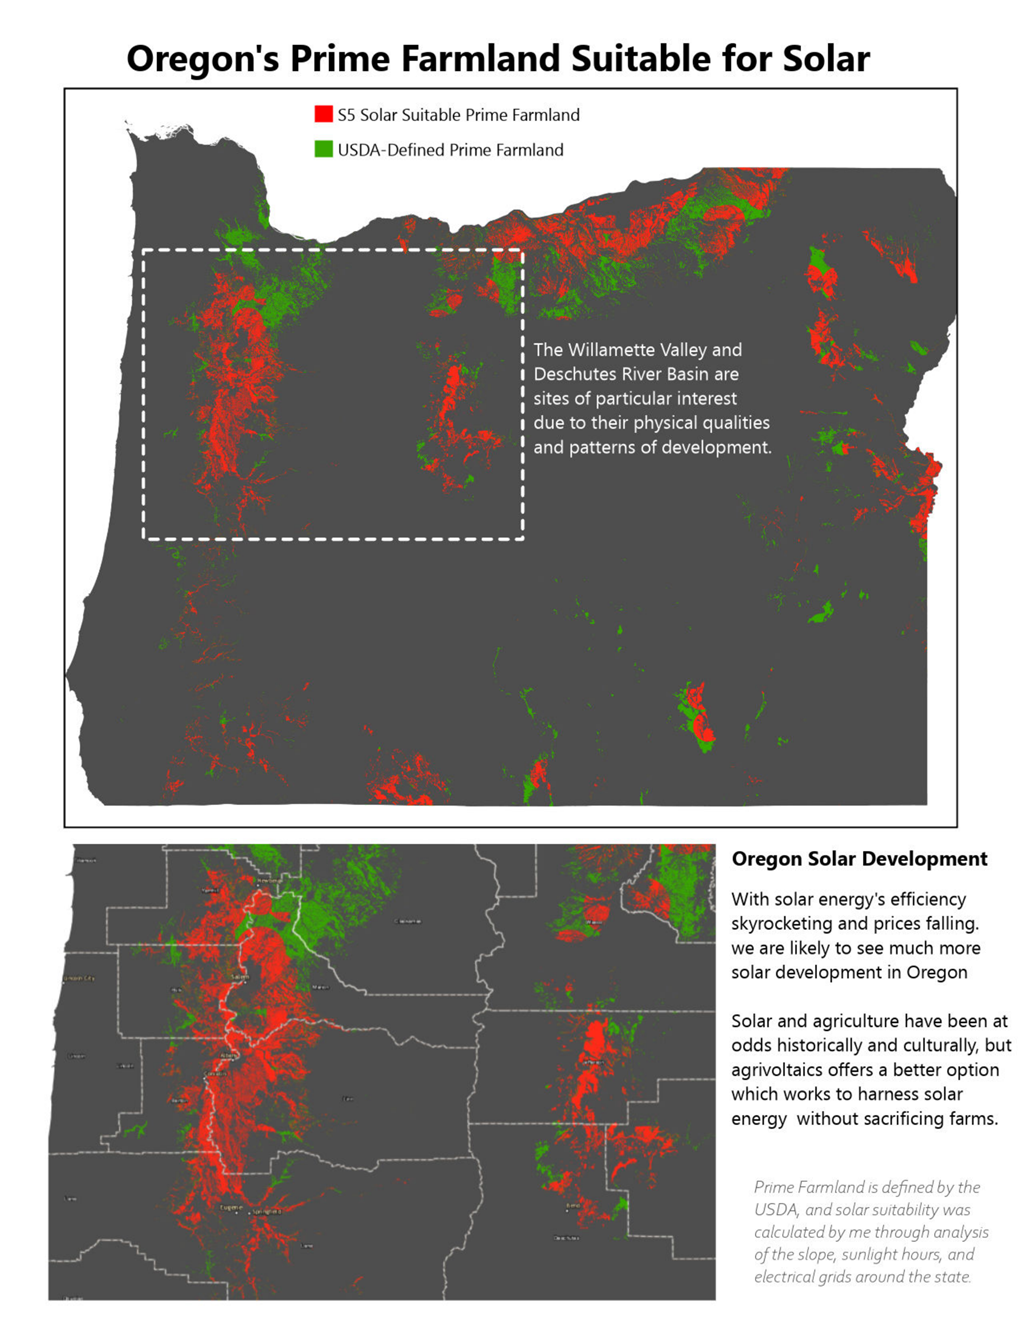
The Substation / Solar / Slope Suitability Study (I had fun coming up with that one) was a self-guided research project I actually got $1,000 dollars from my school for. Essentially, I worked with a research mentor at a national, agricultural non-profit to do some GIS analysis. I chose the theme and setting, being solar agriculture in Oregon.
Solar agricultural (agrivoltaics) is the practice of putting solar panels above or beside crops to double the use of the land. My work wasn’t supporting the creation of this, though. Instead, the purpose was to highlight that farmland is a common target for the bad kind of solar development. A dual-use system is the sexy alternative.
Anyways, the map I made shows exactly what land is “suitable” for solar development using different metrics. The proximity to electric substations, amount of sunlight, and slope of an area are all spatial variables I referenced. Overall, I never thought that land use mapping would be so interesting, but it was a pleasure to work on.
Portrush Antique Map:
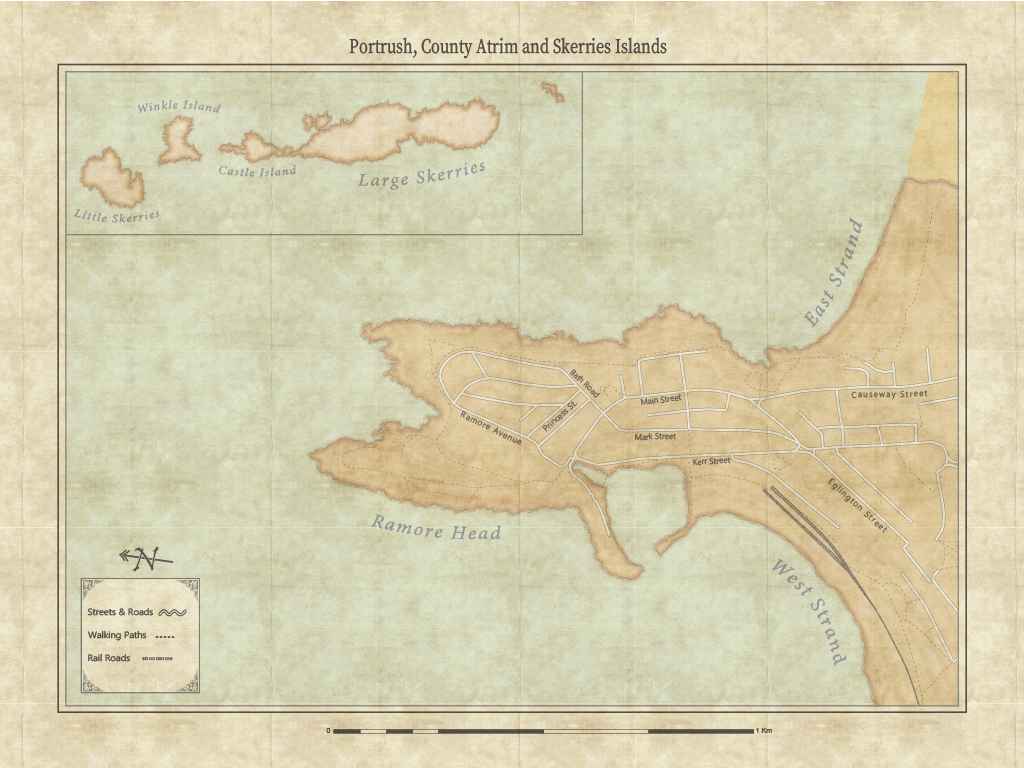
The largest map I’ve ever made, because it was intended to be printed at poster-size. A gift for a close family member, I really tried to make this map seem “nostalgic” with its look. I had a ton of fun making this, and it’s the only professional-grade map I’ve made for non-academic purposes.
I used a lot of references for antique maps, especially pirate themed ones. 90% of the data comes from Openstreetmap, and the remaining 10% I drew by hand. Cartographers say that making maps is just as much a visual design process as it is a science, and this displays that perfectly: I used Adobe Illustrator more than my normal mapping software!
SAN FRANCISCO BAY AREA 199X:
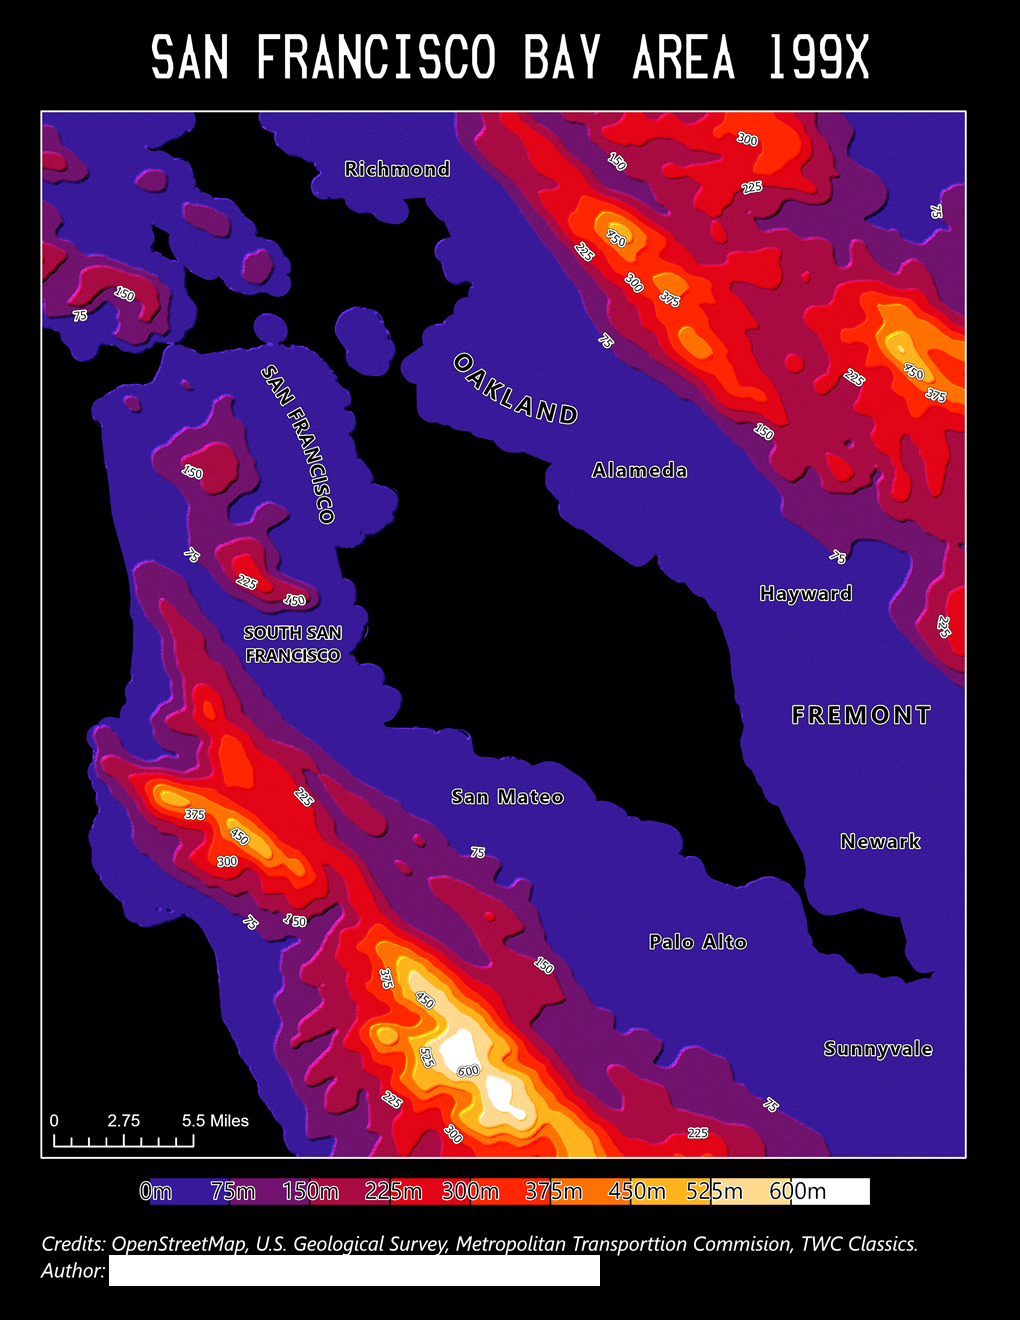
Another product of a class! This one was for a lab on models of topography. We were tasked with choosing a kind of topography, and mapping an area using that. I tried to do something a little original with mine, inspired by the weather channel and misc Y2K aesthetics. The form of shading here is called Tanaka contours, named after its creator.
I really like the plastic-y look of the map, and it shows the different elevations of the bay with striking contrast. Tanaka contours by nature smooth things out, so the end result isn’t very accurate to the rolling hills of SF. Another map made just for the purpose of looking good, not science or analysis. But wow, I really think it looks good…!
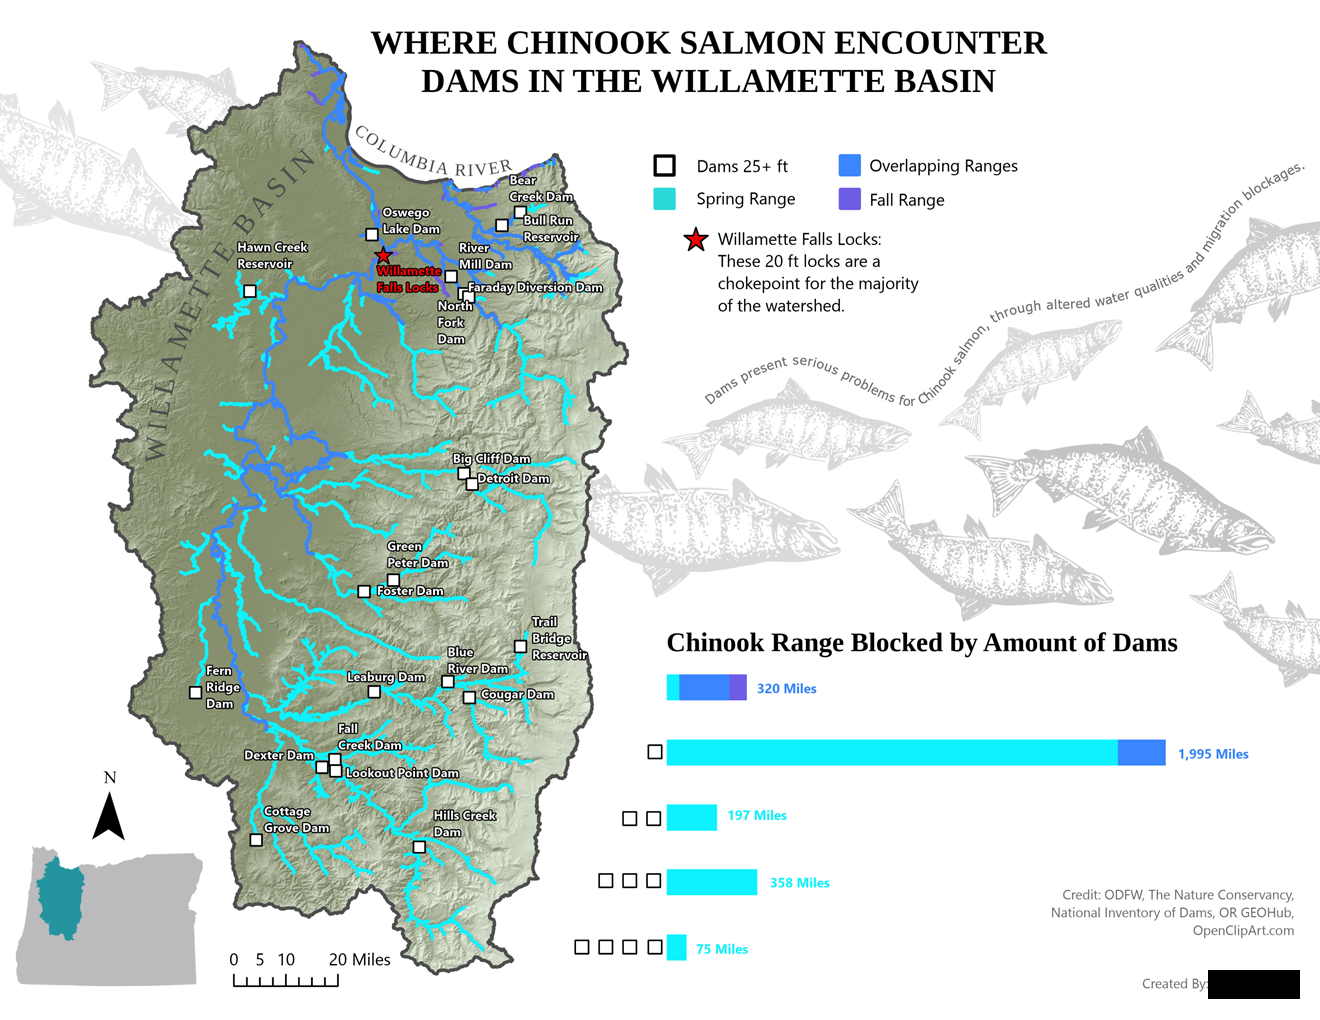
Salmon Obstruction Analysis:
This was my first big mapping / analysis project. What you’re looking at is a spatial analysis of where Chinook Salmon travelling upstream through the Willamette River Basin in Oregon face obstructions. In other words, where salmon run into dams.
I think the map tells the story of Chinook Salmon in a very visual, effective way. As the color of the salmon range gets lighter, and the elevation tint gets lighter in the hills, there are more and more obstructions. For a salmon returning to spawn way way up past the Hills Creek Dam, it would have to pass FOUR major obstructions. Even getting past one is an issue.
The layout was thoughtfully designed in a few mock-ups to make use of negative space. The bar graph and map of the basin were the main considerations, but I had a lot of space left over: This is where my handy salmon clip art came in!!! A bunch of fishies flow from the left to the right, along with wavy text emulating the curving movement of water. Cute, right?